State of Environment
This dashboard provides an overview of the state of the Cairns environment, including Cairns Regional Council’s environmental and urban sustainability initiatives and performance in 2021/22.
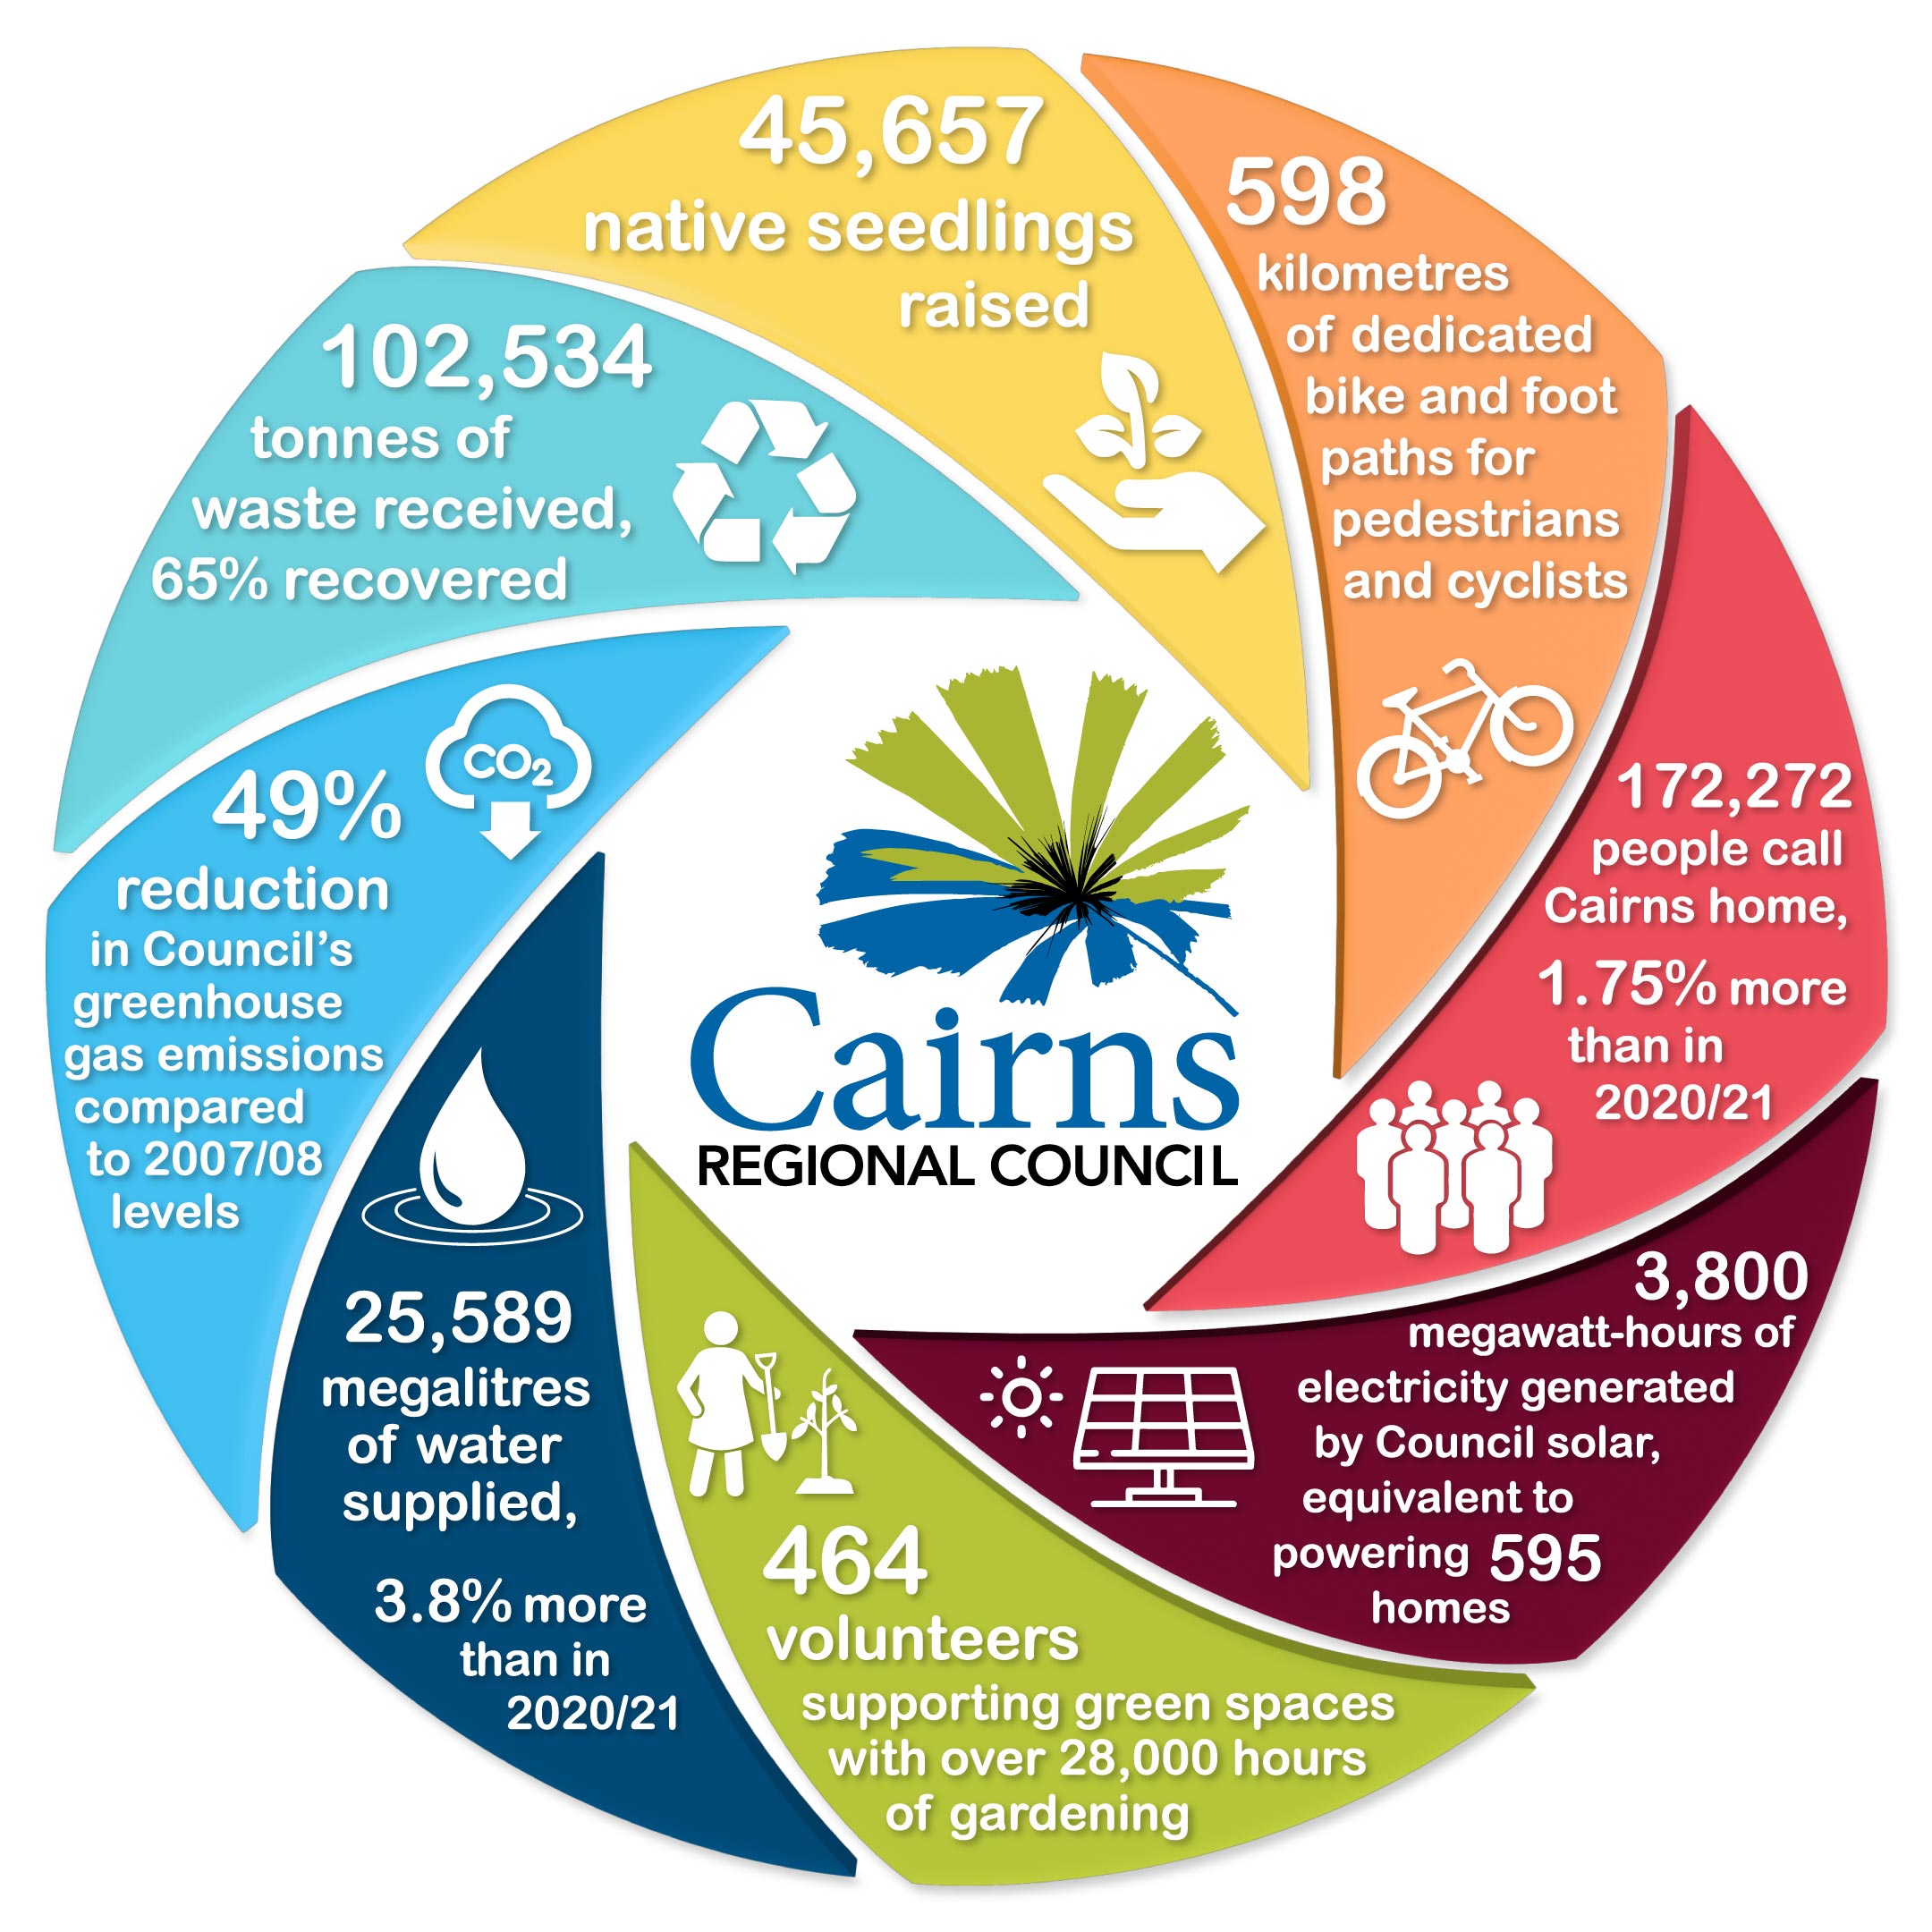
The report draws data from various sources to present a detailed picture of the Cairns environment, including graphs tracking water and energy consumption, annual average rainfall and temperature, development and growth, and waste and recycling. Click, hover, or tap on the graphs to zoom in, see numerical data points or enlarge them to full screen mode.
The report shows the conditions of the local environment, the pressures on the environment and responses to those pressures - an approach commonly used in State of Environment reports.
Click or tap the titles below for more information on each topic (E.g. Climate, Water, etc.).
While State of Environment reporting is not a statutory requirement of local governments in Queensland, Cairns Regional Council considers this to be best practice. This is the 16th release of the report, and the second since moving to an interactive online format. Both the Queensland Government State of Environment and Australian Government State of Environment reports can be accessed online for further information at wider bioregional and national levels.
The report does not provide a complete summary of work done by other agencies in local catchments within the Cairns Local Government Area boundary.
Further information on these agencies can be found on the relevant websites and many are linked to from within these webpages.
This report has been produced by Cairns Regional Council and endorsed at the Planning and Environment Committee meeting on 12 July 2023.
Please note that while every effort has been made to ensure that the information contained within this report is correct and up to date, Cairns Regional Council and all persons acting on its behalf in preparing this report accept no liability for the accuracy or inferences from the material contained in this publication, or for any action as a result of any person’s or group’s interpretations, deductions or conclusions relying on this material. Cairns Regional Council accepts no liability for any loss, damage or injury (including consequential loss, damage or injury) from the use of this information.
Resources
Climate
Average air temperature at Cairns Aero Station
| 2013/14 | 2014/15 | 2015/16 | 2016/17 | 2017/18 | 2018/19 | 2019/20 | 2020/21 | 2021/22 | |
|---|---|---|---|---|---|---|---|---|---|
| Average maximum (°C) | 29.2 | 29.9 | 29.7 | 25.7 | 29.7 | 29.9 | 29.8 | 29.1 | 30.5 |
| Average minimum (°C) | 21.1 | 20.9 | 19.7 | 21.8 | 21.2 | 21.2 | 20.9 | 21.4 | 22.0 |
| Overall average (°C) | 25.2 | 25.4 | 24.7 | 23.8 | 25.5 | 25.6 | 25.4 | 25.2 | 26.2 |
| Days over 35 °C | 0 | 5 | 6 | 5 | 2 | 15 | 8 | 2 | 12 |
Rainfall
| 2013/14 | 2014/15 | 2015/16 | 2016/17 | 2017/18 | 2018/19 | 2019/20 | 2020/21 | 2021/22 | |
|---|---|---|---|---|---|---|---|---|---|
| Annual rainfall - Cairns Aero (mm) | 2,010.0 | 1,501.6 | 1,652.4 | 1,578.3 | 2,321.6 | 2,787.3 | 1,324.6 | 2,541.6 | 1,729.2 |
| Annual rainfall - Babinda Post (mm) | 4,708.5 | 3,069.3 | 3,806.4 | 3,574.7 | 5,170.7 | 4,622.2 | 3,017.7 | 4,616.2 | 4,314.7 |
Water
Water supplied
| 2013/14 | 2014/15 | 2015/16 | 2016/17 | 2017/18 | 2018/19 | 2019/20 | 2020/21 | 2021/22 | |
|---|---|---|---|---|---|---|---|---|---|
| Residential (ML) | 16,545.0 | 17,965.0 | 16,954.1 | 16,977.0 | 17,250.6 | 17,473.3 | 18,141.2 | 17,427.4 | 17,914.6 |
| Commercial, industrial, municipal (ML) | 5,338.9 | 6,360.5 | 6,173.0 | 6,134.6 | 6,383.3 | 6,413.2 | 6,295.7 | 6,217.6 | 6,156.9 |
| Other (ML) | 1,334.7 | 724.9 | 289.8 | 412.6 | 544.4 | 1,050.3 | 781.9 | 1,006.9 | 1,517.5 |
| Total (ML) | 23,218.5 | 25,050.4 | 23,416.8 | 23,524.2 | 24,178.3 | 24,936.7 | 25,218.8 | 24,651.9 | 25,588.9 |
Wastewater processed
| 2013/14 | 2014/15 | 2015/16 | 2016/17 | 2017/18 | 2018/19 | 2019/20 | 2020/21 | 2021/22 | |
|---|---|---|---|---|---|---|---|---|---|
| Total volume treated (ML) | 20,653.4 | 18,987.9 | 18,568.9 | 19,257.5 | 20,821.2 | 22,981.7 | 18,515.8 | 20,435.0 | 20,440.3 |
| Volume discharged | 19,553.4 | 17,810.5 | 17,541.0 | 18,484.6 | 20,211.1 | 22,681.1 | 18,138.9 | 20,773.1 | 20,142.6 |
| Proportion recycled | 11.1% | 11.6% | 12.3% | 11.3% | 10.2% | 8.4% | 2.9% | 8.5% | 9.0% |
Biodiversity
Species found in Cairns, by Queensland conservation status
| Least concern | Special least concern | Near threshold | Vulnerable | Endangered | Critically endangered | Extinct in the wild | Extinct | Not classified |
|---|---|---|---|---|---|---|---|---|
| 2,782 | 287 | 45 | 71 | 35 | 17 | 1 | 0 | 732 |
The Cairns Local Government Area features 422 introduced species:
- 421 in the Not Classified conservation status
- 1 in the Least Concern conservation status.
Seedlings raised by Council for revegetation works
| 2013/14 | 2014/15 | 2015/16 | 2016/17 | 2017/18 | 2018/19 | 2019/20 | 2020/21 | 2021/22 | |
|---|---|---|---|---|---|---|---|---|---|
| Number of seedlings raised | 17,013 | 18,063 | 18,652 | 18,752 | 14,924 | 35,453 | 33,529 | 32,874 | 45,657 |
Council pest management
| 2013/14 | 2014/15 | 2015/16 | 2016/17 | 2017/18 | 2018/19 | 2019/20 | 2020/21 | 2021/22 | |
|---|---|---|---|---|---|---|---|---|---|
| Staff hours on pest plant management | 4,652 | 4,914 | 3,189 | 2,960 | 3,270 | 2,859 | 2,006 | 1,304 | 2,444 |
| Staff hours on pest animal management | 1,880 | 1,880 | 1,691 | 1,727 | 1,880 | 2,921 | 3,972 | 3,872 | 3,972 |
| Total staff hours on pest management | 6,532 | 6,794 | 4,880 | 4,687 | 5,150 | 5,780 | 5,978 | 2,243 | 6,416 |
| Area under pest plant surveillance (ha) | Data not available | Data not available | Data not available | 371 | 2,233 | 934 | 519 | 939 | 1,221 |
| Number of coordinated feral pig or wild dog project sites | Data not available | Data not available | Data not available | Data not available | 62 | 93 | 89 | 104 | 94 |
Built environment
Population of Cairns
| 2013/14 | 2014/15 | 2015/16 | 2016/17 | 2017/18 | 2018/19 | 2019/20 | 2020/21 | 2021/22 | |
|---|---|---|---|---|---|---|---|---|---|
| Estimated resident population | 158,574 | 159,944 | 161,573 | 163,872 | 165,844 | 167,342 | 169,021 | 169,312 | 172,272 |
| Average visitor population | 27,923 | 26,453 | 28,506 | 27,033 | 28,226 | 31,796 | 23,719 | 16,038 | 18,476 |
Population estimates for previous years have been revised in response to the release of the 2021 Australian Bureau of Statistics Census data. Previous editions of the State of Environment reporting show past estimates and should be disregarded in favour of the figures shown here.
Number of building approvals
| 2013/14 | 2014/15 | 2015/16 | 2016/17 | 2017/18 | 2018/19 | 2019/20 | 2020/21 | 2021/22 | |
|---|---|---|---|---|---|---|---|---|---|
| Houses | 630 | 613 | 710 | 627 | 639 | 495 | 528 | 1,005 | 719 |
| Residential other | 4 | 56 | 80 | 106 | 525 | 86 | 20 | 30 | 124 |
Transport
Vehicle registrations and licences
| 2013/14 | 2014/15 | 2015/16 | 2016/17 | 2017/18 | 2018/19 | 2019/20 | 2020/21 | 2021/22 | |
|---|---|---|---|---|---|---|---|---|---|
| Cars | 81,308 | 82,115 | 83,661 | 85,370 | 86,493 | 87,082 | 87,665 | 90,007 | 91,693 |
| Trucks | 1,735 | 1,745 | 1,754 | 1,748 | 1,790 | 1,793 | 1,807 | 1,882 | 1,926 |
| Prime movers | 260 | 251 | 228 | 230 | 243 | 262 | 255 | 260 | 265 |
| Buses | 955 | 1,031 | 1,057 | 1,037 | 1,022 | 1,018 | 751 | 826 | 858 |
| Mobile machinery | 199 | 175 | 155 | 141 | 141 | 142 | 145 | 152 | 156 |
| Motorcycles | 7,096 | 7,176 | 7,230 | 7,367 | 7,328 | 7,332 | 7,439 | 7,694 | 7,697 |
| Light commercial vehicles | 27,415 | 28,192 | 28,892 | 29,783 | 30,338 | 30,975 | 31,795 | 33,539 | 34,766 |
| Total vehicles | 118,968 | 120,685 | 122,977 | 125,676 | 127,355 | 128,604 | 129,857 | 134,360 | 137,361 |
| Licences | 111,806 | 113,179 | 115,103 | 117,003 | 118,721 | 119,748 | 122,226 | 124,408 | 126,621 |
Public transport usage
| 2013/14 | 2014/15 | 2015/16 | 2016/17 | 2017/18 | 2018/19 | 2019/20 | 2020/21 | 2021/22 | |
|---|---|---|---|---|---|---|---|---|---|
| Patronage (in persons) | 3,219,731 | 3,145,647 | 3,130,368 | 3,034,330 | 2,828,762 | 2,816,009 | 2,559,231 | 2,128,692 | 2,136,546 |
Waste and recycling
Waste and resource recovery rates
| 2013/14 | 2014/15 | 2015/16 | 2016/17 | 2017/18 | 2018/19 | 2019/20 | 2020/21 | 2021/22 | |
|---|---|---|---|---|---|---|---|---|---|
| Diverted from landfill (t) | 54,319 | 55,179 | 58,860 | 57,571 | 56,224 | 53,896 | 56,918 | 63,077 | 66,295 |
| Sent to landfill (t) | 40,065 | 36,644 | 39,334 | 40,132 | 39,698 | 38,970 | 38,723 | 36,905 | 36,239 |
| Total received (t) | 94,807 | 91,827 | 98,199 | 98,000 | 96,185 | 92,569 | 95,532 | 99,982 | 102,534 |
| Waste generated per capita (kg) | 600 | 572 | 603 | 594 | 576 | 547 | 556 | 576 | 583 |
| Recovery rate | 57.3% | 60.1% | 59.9% | 58.7% | 58.5% | 58.2% | 59.6% | 63.1% | 64.7% |
A small amount of material may be lost to natural processes, resulting in minor differences between the total waste received and the sum of resources diverted and waste sent to landfill.
Contamination rates
| 2013/14 | 2014/15 | 2015/16 | 2016/17 | 2017/18 | 2018/19 | 2019/20 | 2020/21 | 2021/22 | |
|---|---|---|---|---|---|---|---|---|---|
| Proportion of waste in recycle bins | 10.8% | 9.4% | 9.9% | 8.9% | 11.5% | 11.0% | 9.8% | 12.1% | 14.8% |
| Proportion of recycling in waste bins | 23.3% | 23.0% | 20.0% | 17.1% | 16.4% | 15.3% | 20.3% | 17.4% | 18.5% |
These figures are based on waste audits conducted annually around the same time of year and on similar geographic regions. As the audits are limited in scope, they are not necessarily indicative of region-wide waste disposal behaviour.
Council operations
Carbon emissions (tonnes of CO2 equivalent) from Council operations
| 2013/14 | 2014/15 | 2015/16 | 2016/17 | 2017/18 | 2018/19 | 2019/20 | 2020/21 | 2021/22 | |
|---|---|---|---|---|---|---|---|---|---|
| Electricity from facilities | 6,558 | 6,402 | 6,721 | 5,658 | 6,158 | 7,362 | 7,152 | 8,145 | 8,857 |
| Electricity from street, traffic and public lighting | 7,443 | 8,025 | 8,337 | 8,249 | 8,357 | 8,020 | 8,162 | 8,146 | 7,710 |
| Electricity from water or sewerage | 13,900 | 12,871 | 13,347 | 12,648 | 13,126 | 13,322 | 13,322 | 13,265 | 11,727 |
| Other | 2,086 | 365 | 264 | 86 | 36 | 28 | 0 | 0 | 0 |
| Wastewater treatment fugitive emissions | 3,120 | 3,096 | 3,096 | 3,120 | 3,127 | 2,682 | 2,689 | 2,682 | 1,229* |
| Landfill fugitive emissions | 1,591 | 0 | 0 | 0 | 0 | 0 | 0 | 0 | 0 |
| Fuel use emissions | 4,003 | 3,455 | 3,363 | 3,353 | 3,366 | 3,270 | 3,395 | 3,094 | 3,079 |
| Total Council emissions | 38,701 | 34,214 | 35,128 | 33,114 | 34,170 | 34,684 | 34,720 | 35,332 | 32,672 |
| Council's portion of Cairns total emissions^ | - | - | - | - | - | 1.5% | 1.6% | 1.7% | 1.5% |
* Updates to National Greenhouse and Energy Reporting scheme (NGERS) methodologies provided by the Clean Energy Regulator led to improved accuracy in wastewater treatment fugitive emissions calculations. The updated methodology suggests that previous figures for this emissions source were overestimated, as can be seen in the data for years prior to 2021/22.
^ Compared to municipal emissions estimates provided by Snapshot Climate (developed by Ironbark Sustainability & Beyond Zero Emissions).
Fuel, water and electricity used by Council operations
| 2013/14 | 2014/15 | 2015/16 | 2016/17 | 2017/18 | 2018/19 | 2019/20 | 2020/21 | 2021/22 | |
|---|---|---|---|---|---|---|---|---|---|
| Council electricity use (MWh) | 36,520 | 34,140 | 36,375 | 34,298 | 35,503 | 37,456 | 36,798 | 38,684 | 39,160 |
| Council electricity use supplied by onsite solar generation (MWh) | 85 | 85 | 85 | 142 | 468 | 1,542 | 1,445 | 2,195 | 3,793 |
| Proportion of Council electricity supplied by onsite solar | 0.2% | 0.2% | 0.2% | 0.4% | 1.3% | 4.1% | 3.9% | 5.7% | 9.7% |
| Council fuel use (L) | 1,501,563 | 1,290,902 | 1,246,232 | 1,242,389 | 1,246,554 | 1,209,301 | 1,257,301 | 1,145,863 | 1,139,847 |
| Council water use (ML) | 777 | 1,074 | 904 | 877 | 1,067 | 1,077 | 993 | 1,520 | 1,123 |
| Council water use as a percentage of community use | 3.3% | 4.3% | 3.9% | 3.7% | 4.4% | 4.3% | 3.9% | 6.2% | 4.4% |
About the reporting
State of Environment reporting is constantly being strengthened for increased readability and accuracy. The latest report records the most correct data as new knowledge becomes available. Data discrepancy between reports can be due to a range of factors including de-amalgamation with Douglas Shire, improved data collection, access to new information and changed procedures. Please refer to the latest report for the most up to date data.
Last Updated: 12 July 2023
Latest News > All News

Disaster group to fine-tune its response
An independent after-action review into the wettest cyclone in Australia’s history has made 17 recommendations to improve responses to disaster...

Advocacy priorities ahead of State Election
Council today endorsed its advocacy priorities in the lead up to the State Election....

Success flows during first 100 days in office
A report was tabled at today's Ordinary Meeting reviewing the first 100 days of the newly elected Council....